Wal-Mart Stores, Inc. (Walmart-WMT)
Wal-Mart Stores, Inc. (Walmart) serves customers and club members more than 200 million times per week at more than 8,000 retail units under 53 different banners in 15 countries. The Company operates in three business segments: Walmart U.S. and Sam’s Club in the United States, and Walmart International in 14 countries and Puerto Rico.
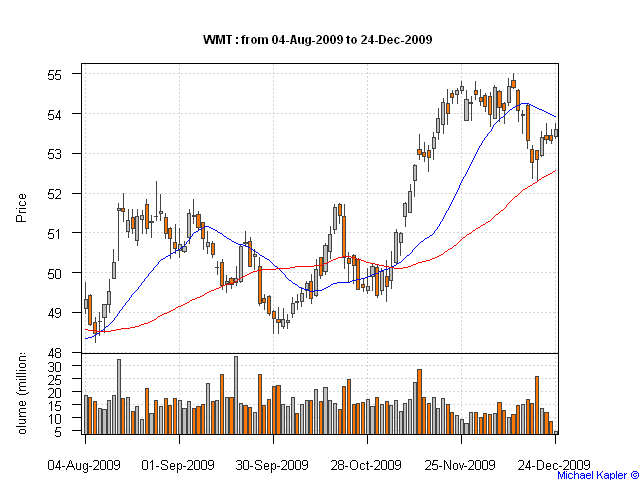
Above is a 5 month chart for Walmart, the stock decline began in December.
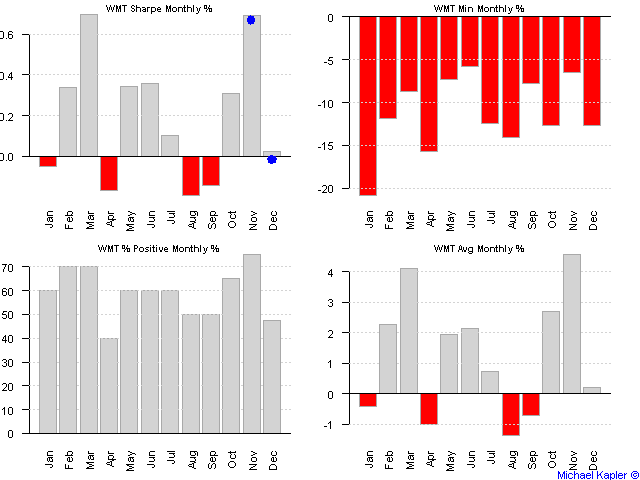
Historically Walmart has a strong November, followed by a weakness in December. 2009 is no exception from a 20 years historical trend. Following charts shows historical performance for Walmart each month over the last 20 years.
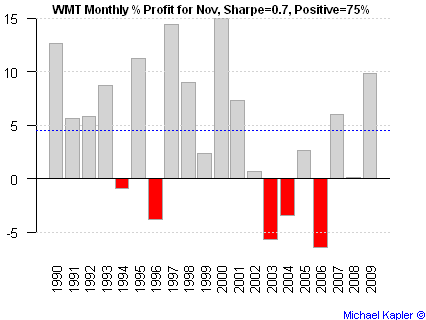
Digging dipper, let's look at the detail historical returns for November and December. Following chart shows monthly historical performance for Walmart in November. The performance was positive 75% of time with average return of 4.5%, and the worst return was -6.5% in November 2006.
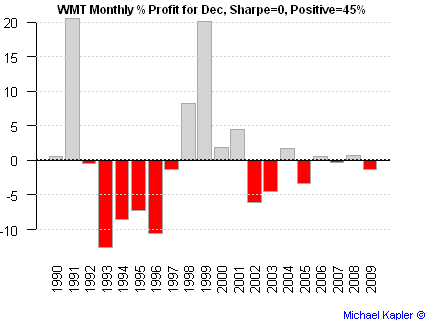
The picture is drastically different for December. Following chart shows monthly historical performance for Walmart in December. The performance was positive 47% ot time with average return of 0.2%, and the worst return was -12.7% in December 1993.
So what happens in December causing Walmart to decline? Following charts shows Walmart's recent price chart; November is highlighted with orange.
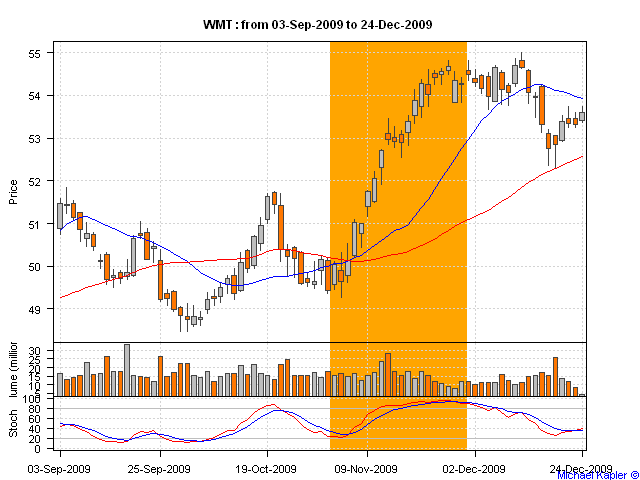
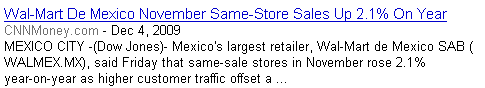
This year, Walmart has reported its Same-Store sales on Dec 4th. Sales were not as impressive as expected by analyst's causing Walmart stock to take a tumble.
This case study was done using Seasonality Analysis tool.
Wal-Mart Stores, Inc. (Walmart) serves customers and club members more than 200 million times per week at more than 8,000 retail units under 53 different banners in 15 countries. The Company operates in three business segments: Walmart U.S. and Sam’s Club in the United States, and Walmart International in 14 countries and Puerto Rico.
Above is a 5 month chart for Walmart, the stock decline began in December.
Historically Walmart has a strong November, followed by a weakness in December. 2009 is no exception from a 20 years historical trend. Following charts shows historical performance for Walmart each month over the last 20 years.
Digging dipper, let's look at the detail historical returns for November and December. Following chart shows monthly historical performance for Walmart in November. The performance was positive 75% of time with average return of 4.5%, and the worst return was -6.5% in November 2006.
The picture is drastically different for December. Following chart shows monthly historical performance for Walmart in December. The performance was positive 47% ot time with average return of 0.2%, and the worst return was -12.7% in December 1993.
So what happens in December causing Walmart to decline? Following charts shows Walmart's recent price chart; November is highlighted with orange.
This year, Walmart has reported its Same-Store sales on Dec 4th. Sales were not as impressive as expected by analyst's causing Walmart stock to take a tumble.
This case study was done using Seasonality Analysis tool.
| Michael Kapler © |