VaR Tool - this program computes and presents Value at Risk (VaR) statistics for a given stock portfolio or historical strategy returns.
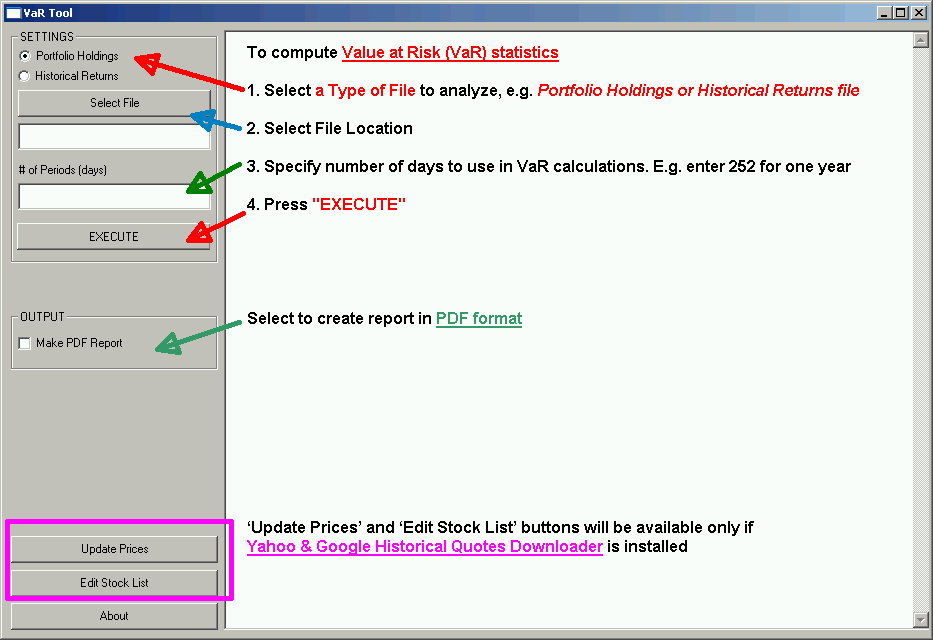
A typical session begins with a user selecting a type of portfolio to analyze, either Portfolio Holdings or Historical Returns. Next, select File Location and specify number of days to use in VaR calculations. E.g. enter 252 for one year. After clicking "EXECUTE", the output report with Value at Risk (VaR) statistics is created.
To install please first install R, Yahoo & Google Historical Quotes Downloader. Next download and unzip VaR Tool. To run execute VaRTool.exe.
This program requires R installation because all calculations are carried out in R. I also recommend to install Yahoo & Google Historical Quotes Downloader to automatically update your stock prices.
Help for VaRTool project
Introduction to Value at Risk Tool
This application is a tool to help you calculate VaR statistics for your portfolios.
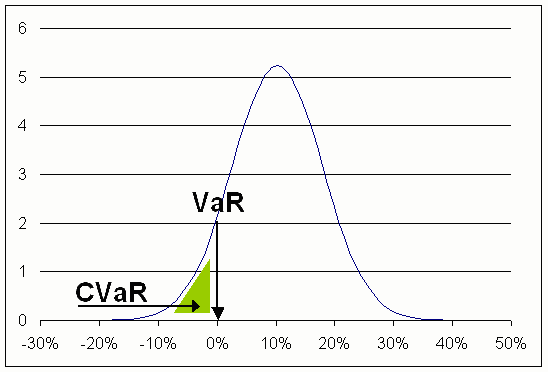
Value at Risk (VaR) is a widely used risk measure of the risk of loss on a specific portfolio of financial assets.
For instance, if you want to know how much money your portfolio can lose in the worst 5% case, you examine a 95% VaR value.
For instance, if you want to know how much money your portfolio can lose on average in the worst 5%,4%,3%,2%,1% scenarios, you examine a 95% CVaR value (Conditional Value at Risk).
Main Screen
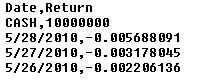
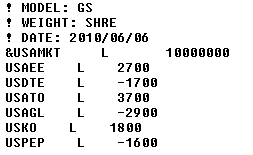
The VaRTool program can read data in the following formats for Historical Returns file:
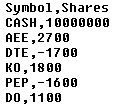
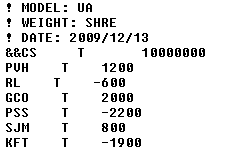
The VaRTool program can read data in the following formats for Portfolio Holdings file:
VaRTool Report
Value at Risk Report contains visual and descriptive statistics to a given portfolio or historical returns.
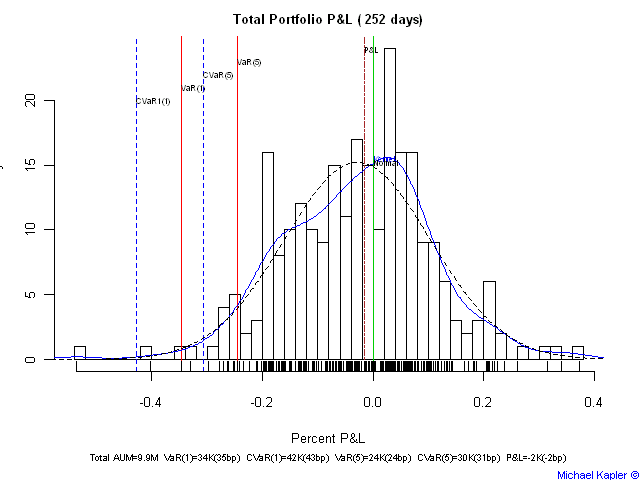
First graph is a historgram of returns over a specified period with 1% and 5% VaR and CVaR higlighted.
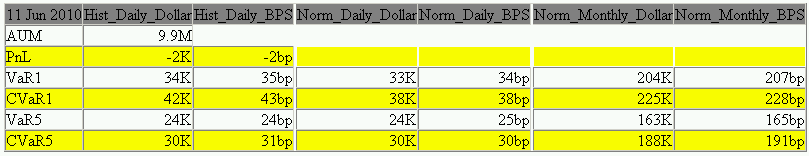
Following table presents various statistics for 1% and 5% VaR and CVaR. Daily Historical dollar and bps(basis points) statistics are computed from the daily historical returns. Normal Daily statistics are computed based on the mean and standard deviation of the daily historical returns, assuming normal distribution. Normal Monthly statistics are converted from Normal Daily statistics.
Details for various Value at Risk computations. Details for conversion Value At Risk To Different Time Periods.
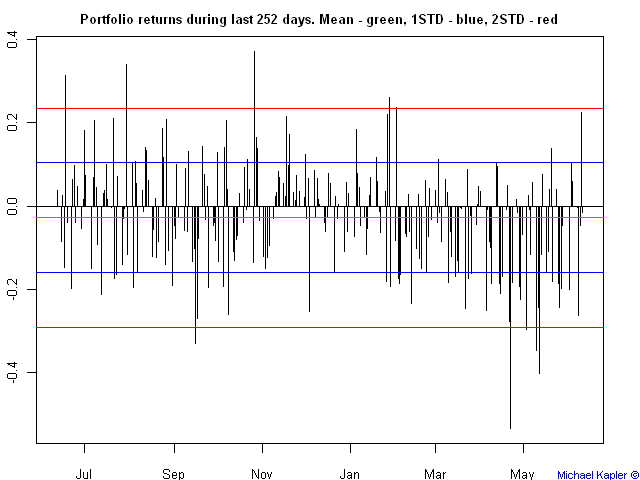
Following graph plots historical returns used in VaR calculations.
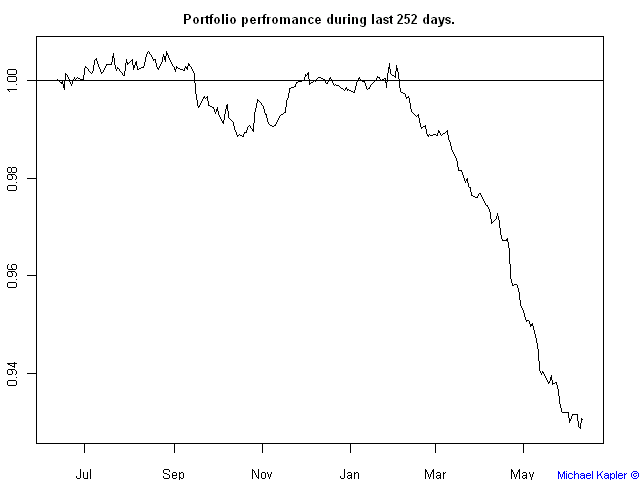
Following graph plots cumulative historical returns.
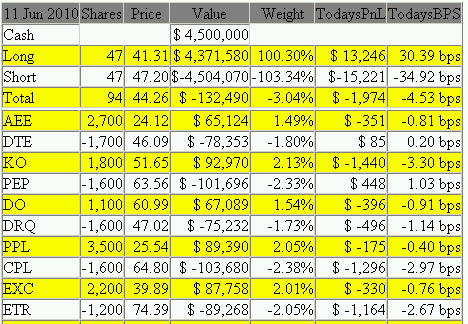
Following table presents current portfolio composition if Portfolio Holdings file was used for VaR calculations.
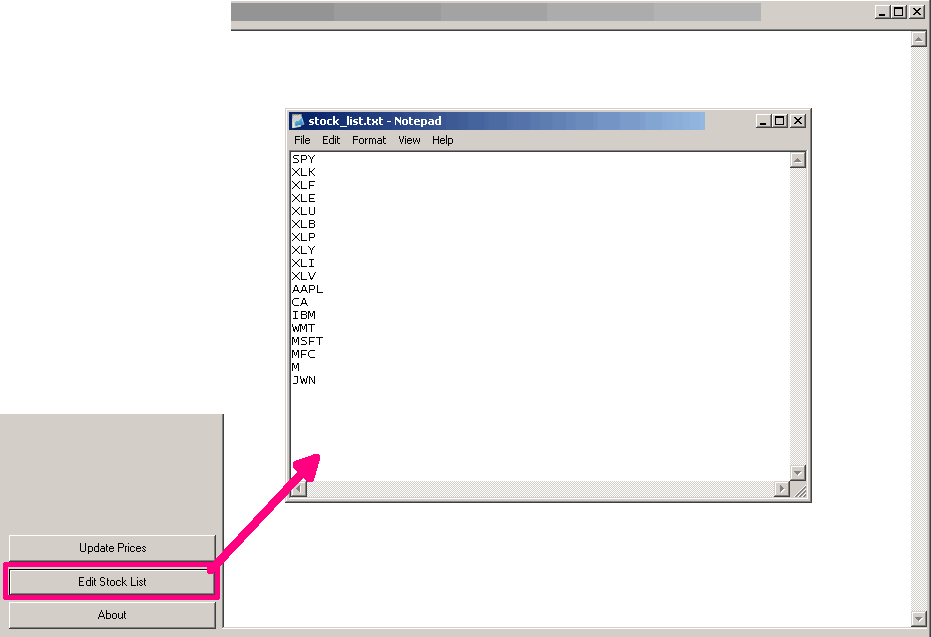
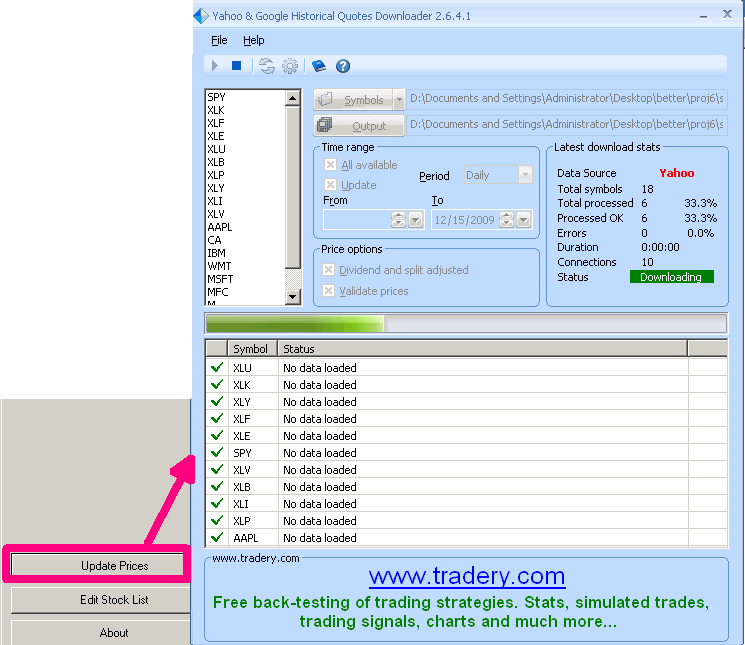
'Update Prices' and 'Edit Stock List' buttons will be available only if Yahoo & Google Historical Quotes Downloader is installed.
'Edit Stock List' button
Press 'Edit Stock List' button to open stock list file in notepad. Add/Delete/Update list of tickers to be downloaded. Save file when done. Please note that all tickers must be valid Yahoo Finance tickers.
'Update Prices' button
Press 'Update Prices' to download data for all companies in stock list file. The Yahoo & Google Historical Quotes Downloader will start automatically. Please wait till all symbols are downloaded.
Frequently Asked Questions
Following are most likely reason for an Error message:
This program is free, but donations to support it will be appreciated. Click below if you wish to make a donation.
A typical session begins with a user selecting a type of portfolio to analyze, either Portfolio Holdings or Historical Returns. Next, select File Location and specify number of days to use in VaR calculations. E.g. enter 252 for one year. After clicking "EXECUTE", the output report with Value at Risk (VaR) statistics is created.
To install please first install R, Yahoo & Google Historical Quotes Downloader. Next download and unzip VaR Tool. To run execute VaRTool.exe.
This program requires R installation because all calculations are carried out in R. I also recommend to install Yahoo & Google Historical Quotes Downloader to automatically update your stock prices.
Help for VaRTool project
Introduction to Value at Risk Tool
This application is a tool to help you calculate VaR statistics for your portfolios.
Value at Risk (VaR) is a widely used risk measure of the risk of loss on a specific portfolio of financial assets.
For instance, if you want to know how much money your portfolio can lose in the worst 5% case, you examine a 95% VaR value.
For instance, if you want to know how much money your portfolio can lose on average in the worst 5%,4%,3%,2%,1% scenarios, you examine a 95% CVaR value (Conditional Value at Risk).
Main Screen
The VaRTool program can read data in the following formats for Historical Returns file:
The VaRTool program can read data in the following formats for Portfolio Holdings file:
VaRTool Report
Value at Risk Report contains visual and descriptive statistics to a given portfolio or historical returns.
First graph is a historgram of returns over a specified period with 1% and 5% VaR and CVaR higlighted.
Following table presents various statistics for 1% and 5% VaR and CVaR. Daily Historical dollar and bps(basis points) statistics are computed from the daily historical returns. Normal Daily statistics are computed based on the mean and standard deviation of the daily historical returns, assuming normal distribution. Normal Monthly statistics are converted from Normal Daily statistics.
Details for various Value at Risk computations. Details for conversion Value At Risk To Different Time Periods.
Following graph plots historical returns used in VaR calculations.
Following graph plots cumulative historical returns.
Following table presents current portfolio composition if Portfolio Holdings file was used for VaR calculations.
'Update Prices' and 'Edit Stock List' buttons will be available only if Yahoo & Google Historical Quotes Downloader is installed.
'Edit Stock List' button
Press 'Edit Stock List' button to open stock list file in notepad. Add/Delete/Update list of tickers to be downloaded. Save file when done. Please note that all tickers must be valid Yahoo Finance tickers.
'Update Prices' button
Press 'Update Prices' to download data for all companies in stock list file. The Yahoo & Google Historical Quotes Downloader will start automatically. Please wait till all symbols are downloaded.
Frequently Asked Questions
Following are most likely reason for an Error message:
- The File Format and selected file are different. E.g. The "Portfolio Holdings" type is selected but "Historical Returns" file is selected.
- The Historical Data for stocks in the portfolio is not available. E.g. There is an IBM holdings in your portfolio, but IBM stock prices were not yet downloaded. Specify IBM in "Stock List" file and click "Update Prices"
This program is free, but donations to support it will be appreciated. Click below if you wish to make a donation.
| Michael Kapler © |